Layo Population Graph


| 2 of 4 | << First | < Previous | Next > | Last >> | Back to gallery |
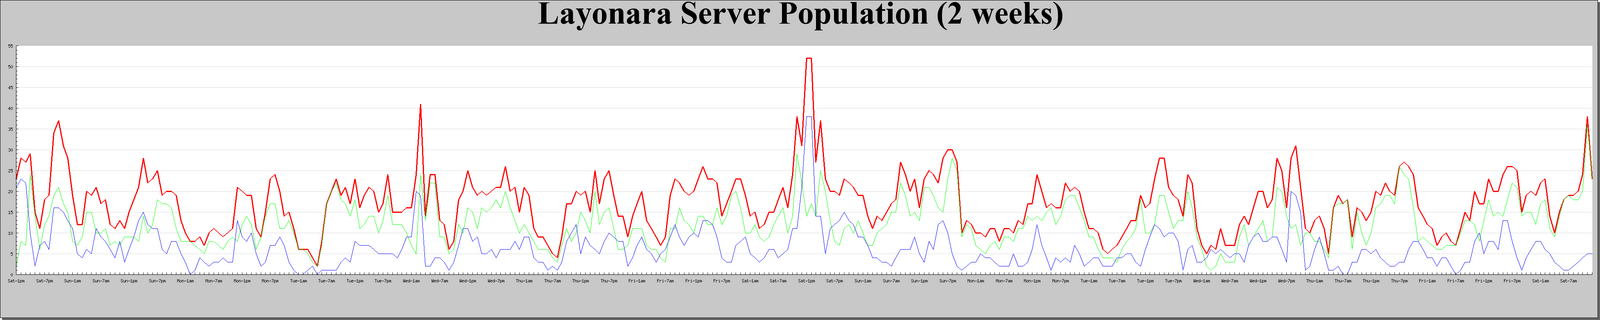
The population of the server as a function of time, over the past two weeks. The green line indicates the population of the West server, the blue the population of the Central server.
The red is the sum of the two. Looks like a peak around fifty-two people last Saturday... let's do better, eh? ;)